


Out of hundreds of available indicators and technical analysis oscillators, one that is less known and unavailable on the MetaTrader platform is the Aroon indicator. Let’s learn more about it and how to use it in Forex trading strategies.
This indicator was created by Tushar Chande, an American inventor, scientist, author and trader with a PhD in engineering and nine US registered patents.
Chande is also a director of Chicago’s Tuscarora Capital Management and a seasoned futures trader. One of his best-known items is the book “The New Technical Trader“, which he co-wrote with Stanley Kroll, as well as “Beyond Technical Analysis” on technical analysis.
Chande is also an author of articles in Stocks and Commodities Magazine and other technical analysis journals. He has also created a trade management software suite. Finally, he is respected for his expertise in designing innovative trading systems, which help traders to build Forex trading strategies.
Functioning of the Aroon Indicator in Forex trading strategies
The Aroon Indicator technical analysis indicator shows investors whether the analyzed instrument is currently in a trend, and if so, how strong is the trend? The indicator consists of two lines called Aroon Up – rising line and Aroon Down – falling line.
In order to be able to calculate the current value of the Aroon Up line, it is necessary to determine how many periods (how long is one period depends on the interval that is analyzed) have passed since the instrument reached its maximum in the analyzed period of time.
In turn, to determine the Aroon Down value, it is necessary to analogically determine how much time has passed since the instrument reached its minimum in the analyzed period of time. So, the principle is simple, and so is reading the signals.
Use of the Aroon Indicator in Forex trading strategies
Using the Aroon Indicator in Forex trading strategies is not complicated. When the Aroon Up line is above the level of 50%, i.e. above the equilibrium level, Aroon Indicator indicates an upward trend in the analyzed market or financial instrument. If the value of the Aroon Up line is decreasing, it means that the uptrend is weakening. In the event that Aroon Up reaches zero, we can talk about the end of the uptrend.
The same applies to the downtrend. When the Aroon Down line is above the 50% level, i.e. above the equilibrium level, the Aroon Oscillator indicates a downward trend. If the value of the Aroon Down line is decreasing, it means that the downtrend is weakening. In the event that Aroon Down reaches zero, we can talk about the end of the downward trend.
The conclusion is simple – the further the Aroon Up is from zero, the stronger the uptrend, and the further the Aroon Down is from zero, the stronger the downtrend.
Now we will analyze it with an example. Let’s assume that we take the period of the last 30 days into account, the peak of this period was reached 15 days ago, and the minimum in this period was observed 10 days ago.
In this case, the value of the Aroon Up line will reach (30-15) / 30 = 50%, while the value of the Aroon Down line will be at the level of (30-10) / 30 = 67%.
Why is it a percentage? It does not really have to, but it can, because the values of the Aroon Up and Aroon Down indicators are moving, as well as the Relative Strength Index (RSI) in the range from 0 to 100.
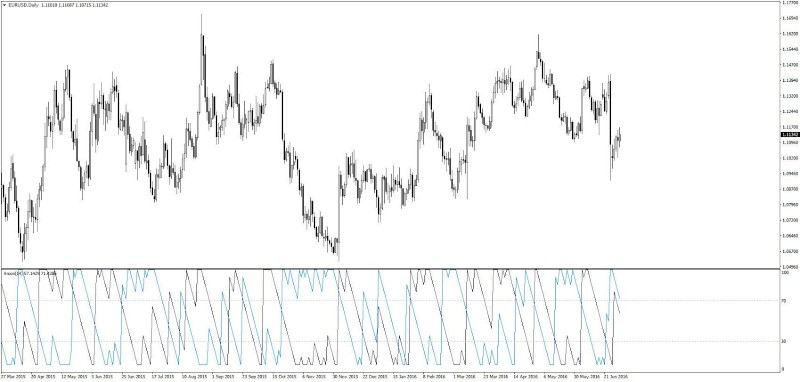
We can also calculate the value of the Aroon indicator, which cannot be seen in the standard Aroon indicator (we can download and add it to MetaTrader 4 platform).
To calculate its value, you need to subtract Aroon Down from Aroon Up. As both lines take values from 0 to 100, Aroon can take a value from -100 to 100. An Aroon value above 0 is an uptrend, and below 0 is a downtrend.
Useful formulas:
- Aroon Up = (OKR – OH) / OKR
- Aroon Down = (OKR – OL) / OKR
- Aroon = Aroon Up – Aroon Down
In the formulas:
- OKR – the number of periods for which we calculate the value of the indicator.
- OH – the number of periods that have passed since the maximum was formed in the analyzed period.
- OL – the number of periods that have passed since the minimum was formed in the studied period.
Pros:
- Ease of use
- Ability to use the indicator to build a wider strategy
- The ability to determine the strength of the trend
- Possibility to determine the direction of the trend
Cons:
- Relatively large amount of false signals
- Slower signals compared to MACD
Conclusion
If you are just beginning your adventure with financial markets, you have a long road ahead of you. There are many indicators to learn about and many strategies to try. Take it one step at a time and work on your market analysis skills.